Points (Colour and Fill Swapped), as for a scatterplot
Description
The geom_point_swap geometry is used to create scatterplots, however, this version swaps the colour and the
fill mappings. Useful if the fill mapping is already occupied (say with existing polygon geometry), this
geometry will allow points of shape 21-25 to use colour mapping for the center colour, and fill mapping for the
border.
Usage
geom_point_swap(mapping = NULL, data = NULL, stat = "identity", position = "identity", ..., na.rm = FALSE, show.legend = NA, inherit.aes = TRUE)
Arguments
- mapping
- Set of aesthetic mappings created by
aesoraes_. If specified andinherit.aes = TRUE(the default), it is combined with the default mapping at the top level of the plot. You must supplymappingif there is no plot mapping. - data
- The data to be displayed in this layer. There are three
options:
If
NULL, the default, the data is inherited from the plot data as specified in the call toggplot. Adata.frame, or other object, will override the plot data. All objects will be fortified to produce a data frame. Seefortifyfor which variables will be created. Afunctionwill be called with a single argument, the plot data. The return value must be adata.frame., and will be used as the layer data. - stat
- The statistical transformation to use on the data for this layer, as a string.
- position
- Position adjustment, either as a string, or the result of a call to a position adjustment function.
- ...
- other arguments passed on to
layer. These are often aesthetics, used to set an aesthetic to a fixed value, likecolor = "red"orsize = 3. They may also be parameters to the paired geom/stat. - na.rm
- If
FALSE, the default, missing values are removed with a warning. IfTRUE, missing values are silently removed. - show.legend
- logical. Should this layer be included in the legends?
NA, the default, includes if any aesthetics are mapped.FALSEnever includes, andTRUEalways includes. - inherit.aes
- If
FALSE, overrides the default aesthetics, rather than combining with them. This is most useful for helper functions that define both data and aesthetics and shouldn't inherit behaviour from the default plot specification, e.g.borders.
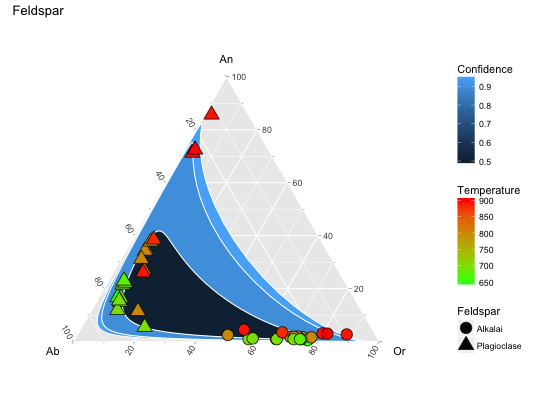
Examples
data(Feldspar)
ggtern(Feldspar,aes(Ab,An,Or)) +
stat_confidence_tern(geom='polygon',aes(fill=..level..),color='white') +
geom_mask() +
geom_point_swap(aes(colour=T.C,shape=Feldspar),fill='black',size=5) +
scale_shape_manual(values=c(21,24)) +
scale_color_gradient(low='green',high='red') +
labs(title="Feldspar",color="Temperature",fill='Confidence')