Draw Text at Relative Position on Viewport
Description
Since it is sometimes counter intuitive for working with ternary or other non-cartesian coordinates in the event that the the user wishes to place a text-geometry based on visual inspection, this geometry positions such text item at a fraction from x=[0,1] and y=[0,1] of the viewport in x and y cartesian coordinates.
Aesthetics
geom_Text understands the following aesthetics (required aesthetics are in bold):
-
label -
x -
y -
alpha -
angle -
colour -
family -
fontface -
hjust -
lineheight -
size -
vjust
Usage
geom_text_viewport(mapping = NULL, data = NULL, stat = "identity", position = "identity", ..., hjust = "inward", vjust = "inward", parse = FALSE, check_overlap = FALSE, na.rm = FALSE, show.legend = NA, inherit.aes = TRUE)
Arguments
- mapping
- Set of aesthetic mappings created by
aesoraes_. If specified andinherit.aes = TRUE(the default), it is combined with the default mapping at the top level of the plot. You must supplymappingif there is no plot mapping. - data
- The data to be displayed in this layer. There are three
options:
If
NULL, the default, the data is inherited from the plot data as specified in the call toggplot. Adata.frame, or other object, will override the plot data. All objects will be fortified to produce a data frame. Seefortifyfor which variables will be created. Afunctionwill be called with a single argument, the plot data. The return value must be adata.frame., and will be used as the layer data. - stat
- The statistical transformation to use on the data for this layer, as a string.
- position
- Position adjustment, either as a string, or the result of a call to a position adjustment function.
- ...
- other arguments passed on to
layer. These are often aesthetics, used to set an aesthetic to a fixed value, likecolor = "red"orsize = 3. They may also be parameters to the paired geom/stat. - hjust
- horizontal justification
- vjust
- vertical justification
- parse
- If TRUE, the labels will be parsed into expressions and displayed as described in ?plotmath
- check_overlap
- If
TRUE, text that overlaps previous text in the same layer will not be plotted. - na.rm
- If
FALSE, the default, missing values are removed with a warning. IfTRUE, missing values are silently removed. - show.legend
- logical. Should this layer be included in the legends?
NA, the default, includes if any aesthetics are mapped.FALSEnever includes, andTRUEalways includes. - inherit.aes
- If
FALSE, overrides the default aesthetics, rather than combining with them. This is most useful for helper functions that define both data and aesthetics and shouldn't inherit behaviour from the default plot specification, e.g.borders.
Examples
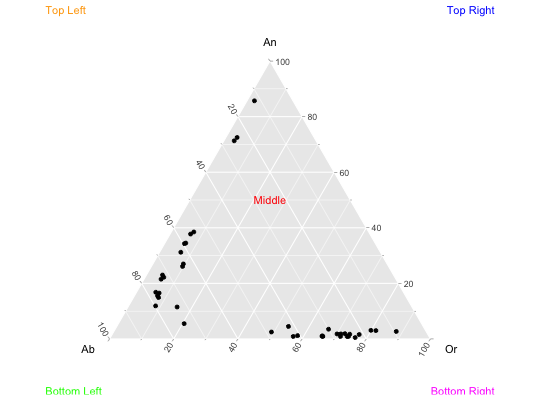
library(ggplot2)
data(Feldspar)
base = ggtern(data=Feldspar,aes(Ab,An,Or)) +
  geom_mask() +
  geom_point() +
  geom_text_viewport(x=0.5,y=0.5,label="Middle",color='red') +
  geom_text_viewport(x=1.0,y=1.0,label="Top Right",color='blue') +
  geom_text_viewport(x=0.0,y=0.0,label="Bottom Left",color='green') +
  geom_text_viewport(x=0.0,y=1.0,label="Top Left",color='orange') +
  geom_text_viewport(x=1.0,y=0.0,label="Bottom Right",color='magenta')
base


base +
  geom_text_viewport(x=0.9,y=0.5,label="Clipping Turned Off",color='purple',hjust=0,clip='on')


base +
  geom_text_viewport(x=0.9,y=0.5,label="Clipping Turned Off",color='purple',hjust=0,clip='off')